Harnessing Power BI Desktop and Service for Smarter Decision Making
Driven software developer with a focus on building scalable applications and solving complex problems. I write to share my knowledge, experiences, and insights in software development.

In the ever-evolving landscape of business intelligence, Power BI has emerged as a game-changer. Whether you are a data enthusiast or a business professional, Power BI makes it easier to analyze, visualize, and share insights. With both Power BI Desktop and Power BI Service, it caters to diverse user needs—from creating detailed reports to publishing and collaborating on them in the cloud.
Here, I’ll take you through the functionalities, advantages, and critical components of Power BI, along with an exploration of its advanced features like semantic modeling, data refresh, dynamic filters, and more.
Understanding Power BI
What is Power BI?
Power BI is a Microsoft-powered suite of business analytics tools that bridges the gap between data and actionable insights. It allows users to connect to various data sources, clean and transform data, and create visually rich reports and dashboards. These can be shared across teams for collaborative decision-making.
Power BI comes in multiple flavors:
Power BI Desktop: A Windows-based application for designing and creating reports.
Power BI Service: A cloud-based platform for sharing and collaborating on reports.
Power BI Mobile Apps: Access reports and dashboards on the go.
Why is Power BI Used?
The primary reason businesses use Power BI is its ability to democratize data. It makes powerful analytics accessible to users, empowering them to:
Identify trends and patterns.
Track key performance indicators (KPIs).
Collaborate seamlessly using shared dashboards.
Perform advanced analytics with minimal learning curves.
For me, the standout feature is its intuitive interface— don’t need to be a data scientist to make sense of complex data.
Power BI: The Pros and Cons
Advantages of Power BI
Interactive Visuals:
Power BI excels at creating visually engaging, interactive dashboards with drag-and-drop functionality.Real-Time Analytics:
Businesses can make real-time decisions using live data streams and automatic dashboard updates.Ease of Collaboration:
With Power BI Service, sharing insights across teams is seamless, enabling data-driven decisions at all levels.Extensive Connectivity:
From Excel sheets to cloud-based services like Azure and Salesforce, Power BI integrates with a vast array of data sources.Cost-Effective:
It offers a free version for small projects, making it ideal for startups and individuals.
Disadvantages of Power BI
Learning Curve for Advanced Features:
While the basics are easy to pick up, advanced functionalities like DAX formulas and modeling can be challenging.Performance Concerns:
Working with large datasets in the free version might slow things down.Internet Dependency:
Power BI Service relies on an internet connection, which can be a limitation for some.
Import vs. Direct Query: Choosing the Right Data Mode
A crucial decision in Power BI is selecting between Import and Direct Query modes, depending on the project requirements.
Import Mode:
Data is imported into Power BI, making reports faster and more responsive. However, it has a data size limitation (1 GB in Power BI Pro).Direct Query:
In this mode, data remains in the source, and Power BI queries it in real-time. While it handles larger datasets, performance depends on the source’s speed and availability.
The Semantic Model: The Backbone of Power BI
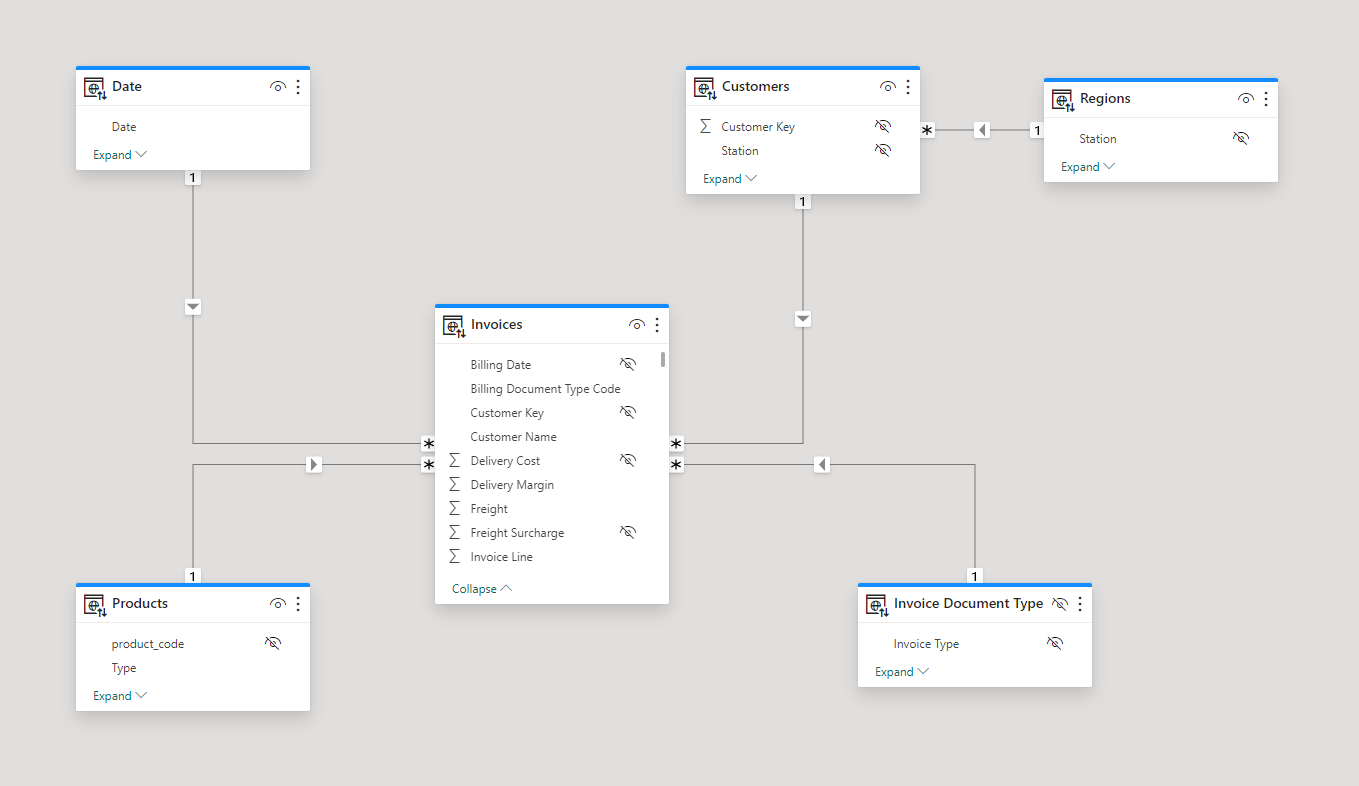
Power BI’s semantic model plays a pivotal role in organizing data for analysis. Think of it as the foundation of your reports, ensuring the data is structured and ready for consumption.
Tables and Columns:
Organize raw data into logical entities.Relationships:
Define how tables relate to each other—like a relational database.Measures and Calculations:
Use DAX (Data Analysis Expressions) to create KPIs, summaries, and insights.Hierarchies:
Create drill-down paths, such as navigating from "Region" to "City" to "Store."
A well-built semantic model can make or break the report’s usability.
Core Features That Stand Out
Data Refresh:
Keeping reports up-to-date is effortless with Power BI’s scheduled refresh options. It ensures data accuracy without manual intervention.Dynamic Filters:
These filters allow users to customize their views on the fly. For example, selecting specific regions or timeframes updates the visuals dynamically.Parameters:
Parameters add flexibility, letting users input values and generate tailored outputs. For instance, a sales report might allow selecting a particular month or product category.Binding:
This feature ensures that visuals are directly tied to underlying data, maintaining consistency throughout the report.Modeling Tools:
Power BI Desktop provides advanced modeling tools to clean, shape, and structure data efficiently.
How Power BI Works
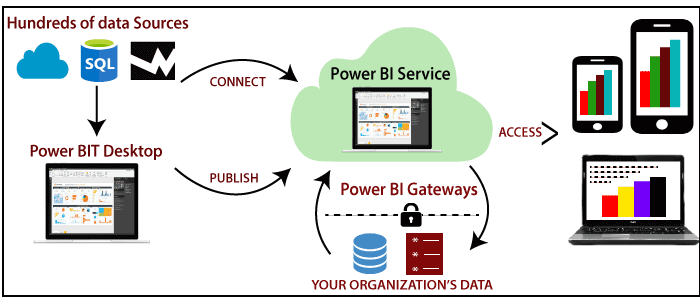
To give you a better picture, here’s the typical workflow in Power BI:
Connect:
Use built-in connectors to link to data sources (e.g., databases, APIs, Excel files).Transform:
Clean and prepare data using Power Query. This step includes removing duplicates, handling missing values, and applying calculations.Model:
Build relationships and define calculations using the semantic model.Visualize:
Create stunning, interactive reports with visuals like charts, graphs, and maps.Publish:
Share reports via Power BI Service for collaborative access.
My Journey with Power BI: From Report Creation to Sharing:
As someone who actively uses Power BI to develop reports and publish them for user access, here’s a step-by-step breakdown of how I leverage its tools to simplify reporting and empower end-users.
1. Connecting to Data Sources
Every report starts with data. Power BI Desktop makes it incredibly simple to connect to various sources like SQL databases, Excel spreadsheets, APIs, and even live web data. Its broad compatibility ensures that no matter where the data resides, I can bring it into Power BI for analysis.
2. Cleaning and Structuring the Data
Once connected, I use Power Query to clean and shape the data. This involves tasks like:
Removing duplicates.
Fixing data types (e.g., numbers, dates).
Combining multiple data sources into a unified dataset.
This stage is crucial because well-structured data makes analysis and visualization much smoother.
3. Creating Interactive Reports
The real magic of Power BI lies in its interactive capabilities. Using its drag-and-drop interface, I design reports that present data in a user-friendly way. Here's how:
Tables: For structured and detailed views of the data, I often use tabular visuals. Tables are excellent for presenting numerical or categorical data, making it easy for users to compare and analyze.
Parameters with Column Filters on Slicers: To make reports more dynamic, I use parameters. For example, users can select specific columns or apply filters using slicers to customize the data view based on their preferences.
Slicers and Filters: These allow users to interact dynamically with the data, narrowing it down to specific segments or criteria for more focused insights.
This approach ensures that end-users can explore the data intuitively without feeling overwhelmed.
4. Publishing to Power BI Service
Once the report is finalized, I publish it to the Power BI Service. This step transforms the static report into a live dashboard accessible from any device. The cloud-based service not only stores the reports but also makes sharing and collaboration seamless.
5. Enabling User Access and Export Options
In the service, I configure access permissions, ensuring that only the right users can view the reports. Power BI allows end-users to:
Interact with Data: They can drill through details, apply filters, and explore insights tailored to their needs.
Export Data: Users can export summarized data or detailed datasets directly from the visuals. This feature is particularly useful for teams that need offline analysis or documentation.
6. Automating Data Refreshes
To keep the reports relevant, I set up scheduled data refreshes. This ensures the data syncs with the original source regularly, so users always see the latest information without manual updates.
Why This Workflow Matters ?
For me, this end-to-end process ensures that reports are not just visually appealing but also practical and actionable. Users don’t just see the data—they can explore it, filter it dynamically, and even export it for further analysis.
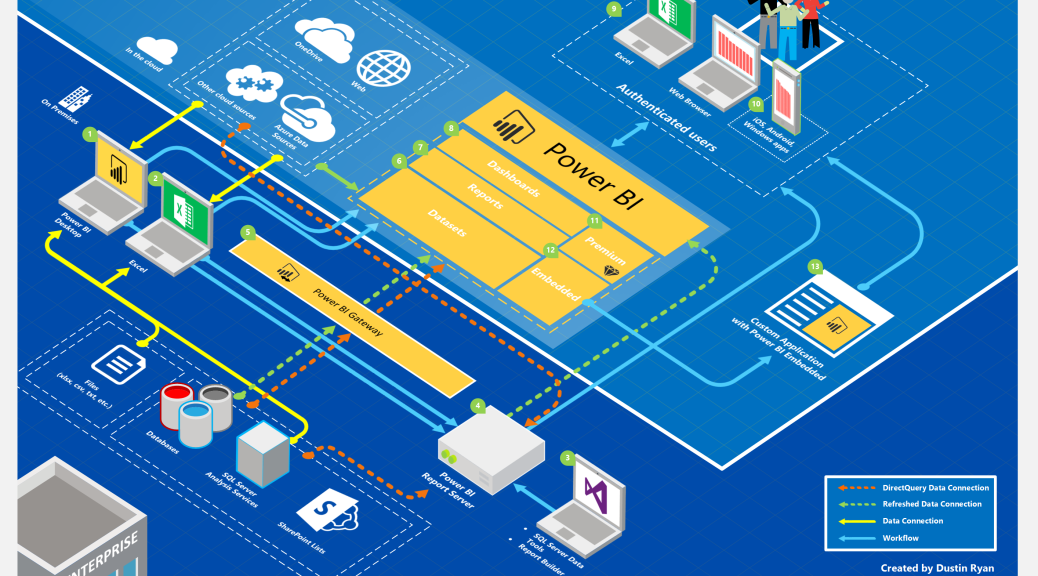
Image Credit: Image by Dustin Ryan via the internet.
Bringing All Together:
Power BI is a powerful and versatile business intelligence tool that empowers users to analyze and visualize data effortlessly. With Power BI Desktop for report creation and Power BI Service for cloud-based sharing, it caters to both individual users and organizations. Power BI stands out for its interactive visuals, real-time analytics, and extensive data connectivity. While it is cost-effective and easy to use, it does require some learning for advanced features like DAX formulas and data modeling. Whether you use Import Mode or Direct Query, the platform provides the flexibility needed for different business requirements. Features like dynamic filters, parameters, and data refresh ensure your reports stay relevant and accurate. With its semantic model for data organization, Power BI is a go-to solution for businesses looking to unlock actionable insights and make data-driven decisions.
Thank you for taking the time to read this blog! I hope you found the information helpful and insightful. If you have any questions or thoughts, feel free to leave a comment below. Stay tuned for more exciting topics in the future!